COVID Risk Cluster Reproduction
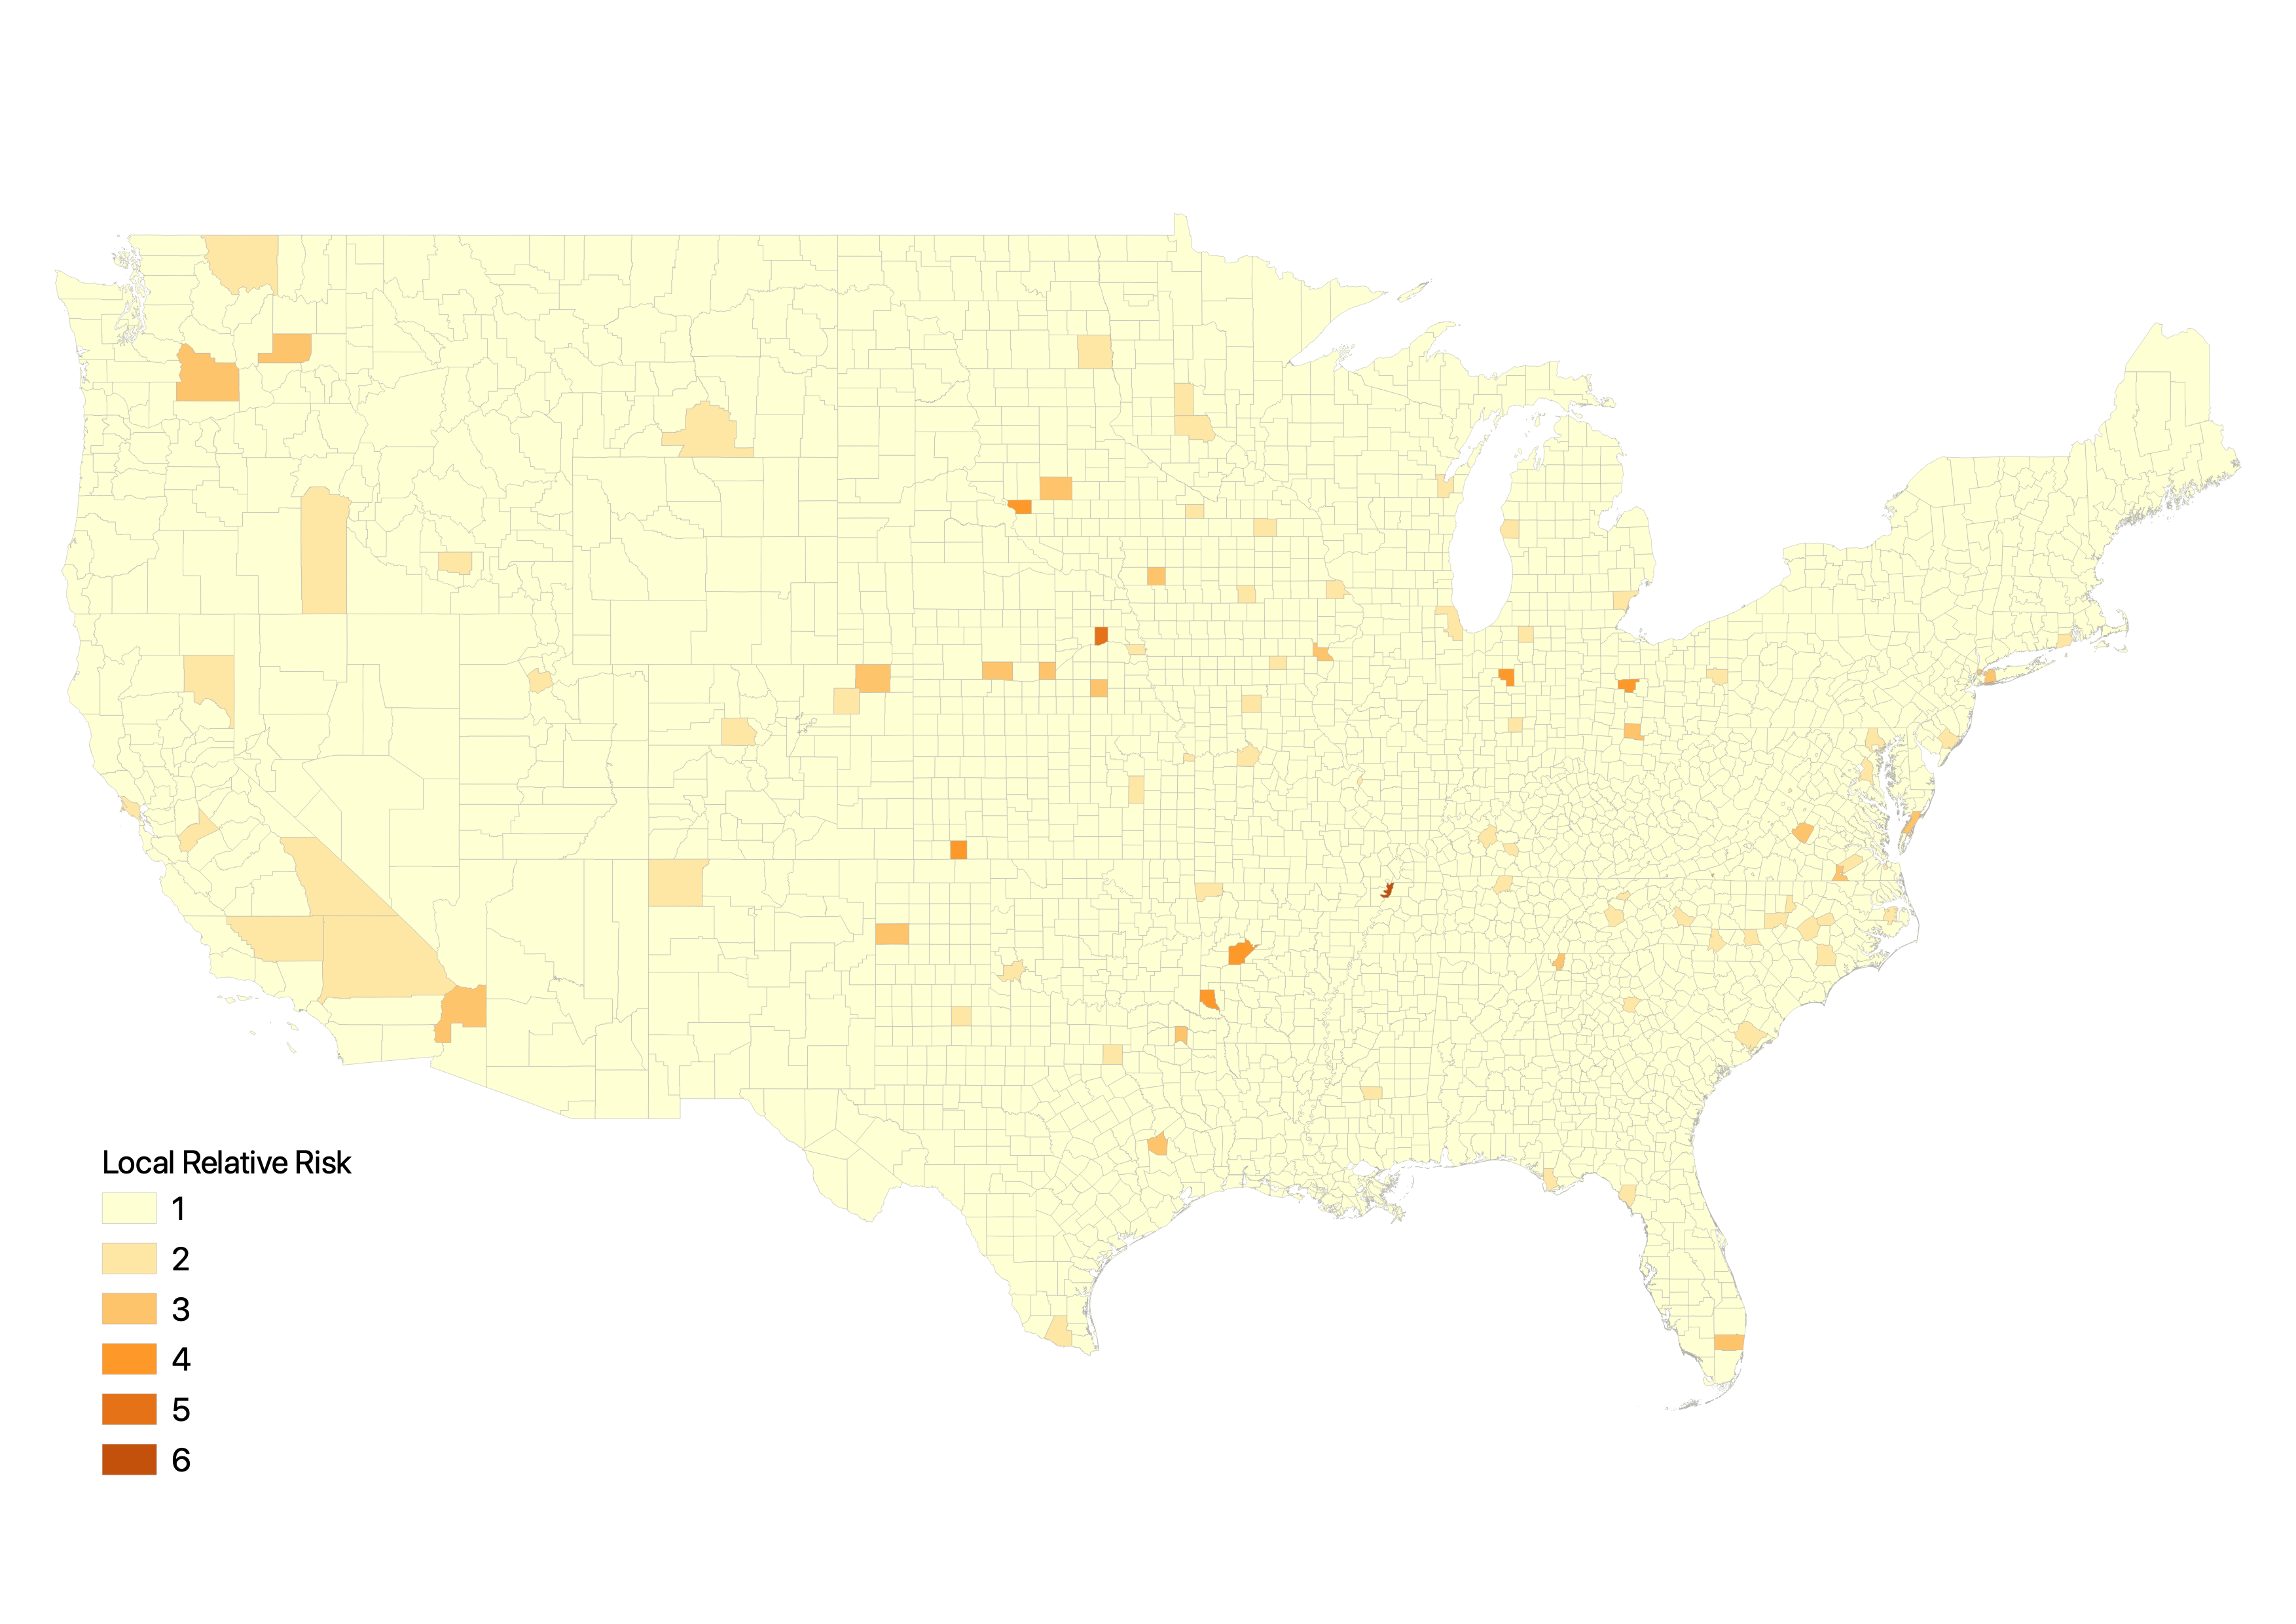
We reproduced a study by xxxxx et al. in order to investigate the relationships between neighboring counties. The method used to establish neighborhoods of counties was Originally, he study only assigned values to the counties at the center of the cluster. In our replication we assigned values to every county. Counties with anomaly high rates of COVID transmission were indicated on a scale of 1 to 6, where 1 was average transmission rates and 6 was especially high transmission rates compared to the counties’ neighbors.
Our reproduction showed that the hotspot analysis did not yield many hotspots. Most of the country had risk scores of 1, with only a few counties with higher risk scores. Even fewer counties scored above 2.
cluster has rel risk score for each cluster, orig. did risk score for center of the cluster applied to the whole cluster, could still be better by avg the risk score or taking the highest risk score in the cluster,
wow the relationships are not strong